반응형
소 스
<!DOCTYPE html>
<html>
<head>
    <script src="http://cdnjs.cloudflare.com/ajax/libs/raphael/2.1.0/raphael-min.js"></script>
    <script src="http://code.jquery.com/jquery-1.8.2.min.js"></script>
    <script src="http://cdn.oesmith.co.uk/morris-0.4.1.min.js"></script>
    <meta charset=utf-8 />
    <title>Morris.js Donut Chart Example</title>
    <script>
        jQuery(document).ready(function($) {
            Morris.Donut({
                element: 'donut-example',
                data: [
                    {label: "label 1", value: 42},
                    {label: "label 2", value: 30},
                    {label: "label 3", value: 20}
                ]
            });
        });
    </script>
</head>
<body>
<div style="width: 300px; height: 300px; background-color: crimson"  id="donut-example"></div>
</body>
</html>
실행결과


반응형
'DEMO CODE > jQuery 활용' 카테고리의 다른 글
| PIP 구현 (Picture-in-Picture) (0) | 2021.03.03 |
|---|---|
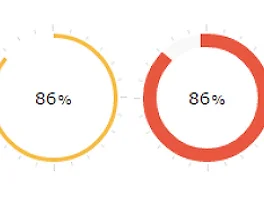
| [Chart] Easy Pie Chart (0) | 2016.03.25 |
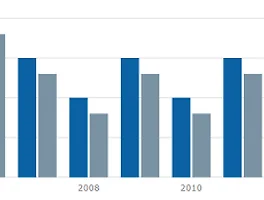
| [Chart] Morris.js Bar Chart (0) | 2016.03.25 |
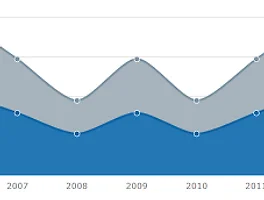
| [Chart] Morris.js Area Chart (0) | 2016.03.25 |
| [Chart] Morris.js Line Chart (0) | 2016.03.25 |